FAANGM Relative Strength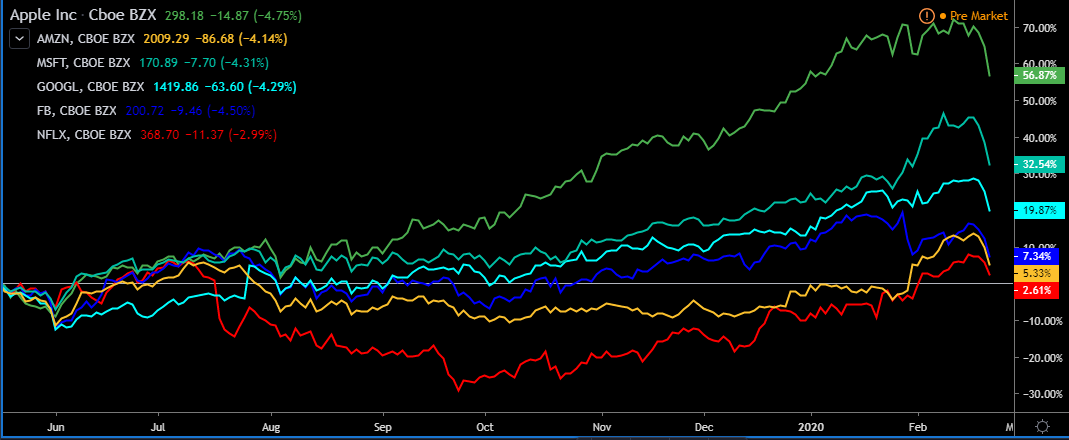
Relative Strength / Weakness
- We keep a watchlist dedicated to stocks showing relative strength. This is most evident during deep corrections when some stocks drop heavily and others manage to stay steady and even close green. However, tracking the strongest stocks is not always the best approach; defensive stocks tend to do a lot better than high-beta tech and while they may be easier to buy in the initial bottoming stages, when the recovery starts they may actually underperform. What is particularly useful is to watch stocks in similar sectors or groups, for example FAANG or NVDA/AMD or GS/BAC/C/JPM. The stocks showing relative strength should be easier to buy on the dip, and also snap back harder. Stronger stocks also tend to bottom first. We saw this during the Q4 2018 decline; many Tech stocks bottomed on 24th December, but AAPL was weaker and only bottomed on 3rd January after a final gap down.
- Relative strength or weakness can tell us what is driving the stock, even the market. For example, the Apple underperformance in 2018 was due to the trade war but this reversed in 2019 and Apple significantly outpeformed in H2 as a trade deal got closer.
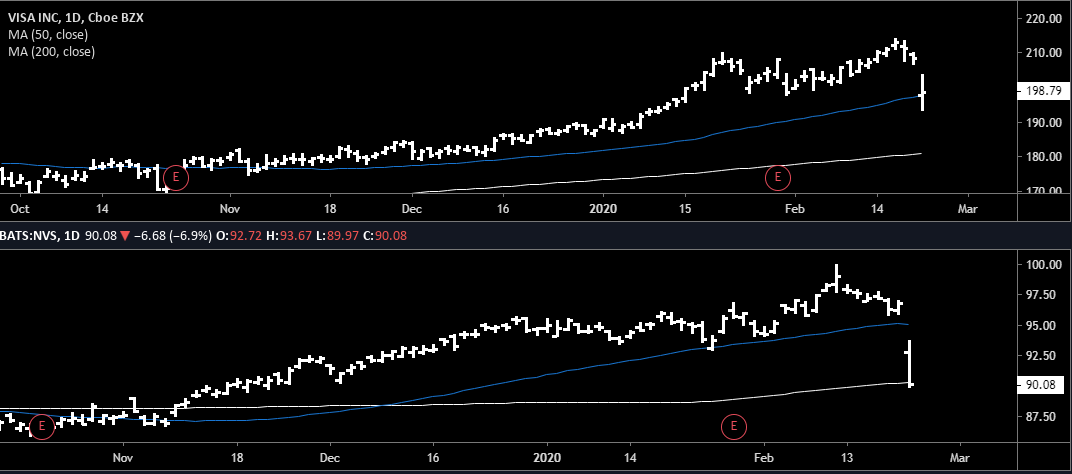
- Tracking relative strength can be simply a comparison of stock performance over time as shown by the main chart of FAANG (+MSFT). Another useful method is to compare the stock price to a major moving average (see evidence). Those that are underperforming the MAs are obviously weaker, and often drop further during broader market corrections.
Moving Averages Example