Breakout
Breakout Trades
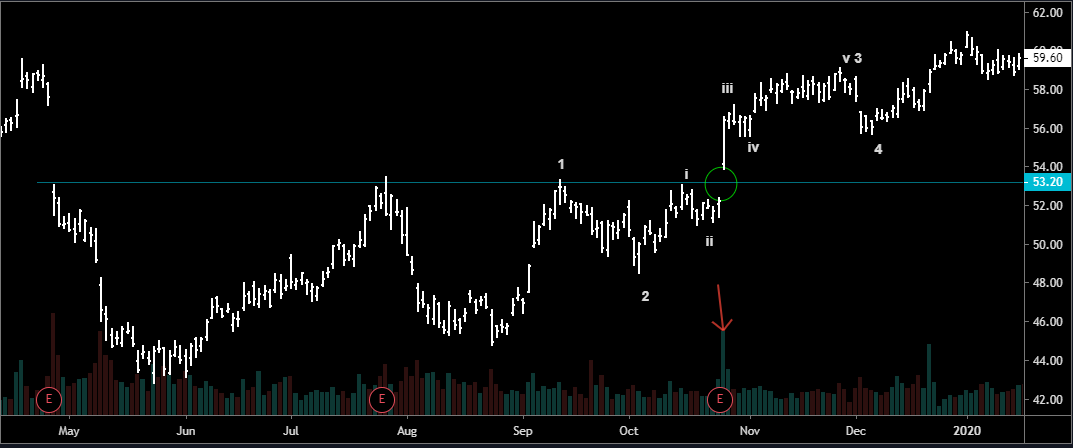
The Intel (INTC) chart shows us a high probability break-out in October. It has a number of key features:
- breaking above a significant level. Ideally this is at all-time highs, but in this example it is at the $53 level which has acted as resistance 4 times. Note how each time this level has been tested the downside reaction is less. This tells us a break-out is imminent.
- Ideally the break-out comes in a potential wave iii of 3 in an Elliott Wave sequence. This should mark around the half-way point of the trend and tell us there is much more upside. A break-out in wave 5 is something to avoid, even fade.
- The break-out should continue higher and should not re-test the break-out level for at least a few sessions, if at all. Beware if the break-out session closes weak.
- Above average volume is desirable.
Entry is best ASAP on the break-out day if the stop out level is not too far. In the INTC example, we could have bought the open around $54, with a stop just under $53. If the stop out level is too far we have to wait for a consolidation when channels/MAs catch up with price. This would be less of a break-out trade and more of a pullback in trend - see appropriate link.